Two fleets can operate in the same industry, in the same city, pay similar prices at the pump and one spends 55% less per vehicle. The difference isn’t luck, better trucks, or a secret supplier relationship. It’s all about efficiency.
At Coast, we see this efficiency gap in real-time. We work with thousands of trade and field service businesses across the country. Every day, we process transactions from fleets of all sizes, across industries, regions, and operating models. That gives us a unique view into how the most efficient fleets operate, where others overspend, and what truly drives fuel costs beyond what shows up on a monthly statement. In other words, we see what the best fleets do differently.
This report takes this Coast data and turns it into practical benchmarks. These insights will help fleet managers audit their current efficiency, budget more accurately for 2026, and identify concrete opportunities for improvement without disrupting operations.
This report draws from hundreds of thousands of anonymized transactions on Coast cards in 2025 and highlights the spending patterns, seasonal swings, and efficiency gaps that separate high-performing fleets from the rest.
The best fleets don’t guess, they benchmark. Let’s dive in.
Understanding Your Fuel Bill
What Efficiency Really Means
Efficiency is about spending less money to get the same amount of work done. An efficient fleet gets more jobs done, with fewer wasted miles, fewer unnecessary stops, and fewer dollars lost to poor habits or weak controls. An inefficient fleet pays more to accomplish the same amount of work. Over the course of a year, that difference compounds into tens or hundreds of thousands of dollars.
So how do you make your fleet more efficient? It’s natural to focus on gas prices first. It’s the number everyone sees at the pump, the one on the evening news, and the most obvious culprit when the monthly statement spikes. But while the market sets the price per gallon, it doesn’t dictate your total bill. Prices are just the most visible part of a much larger equation.
At a high level, your fuel spend is driven by three components:
Fuel cost = Volume x Location x Operations
Only volume is largely outside your control. The other two are the result of operational choices, and can be optimized for higher efficiency. This report will take a closer look at each component and where the biggest opportunities for efficiency are hiding.
Volume: How Much You Drive
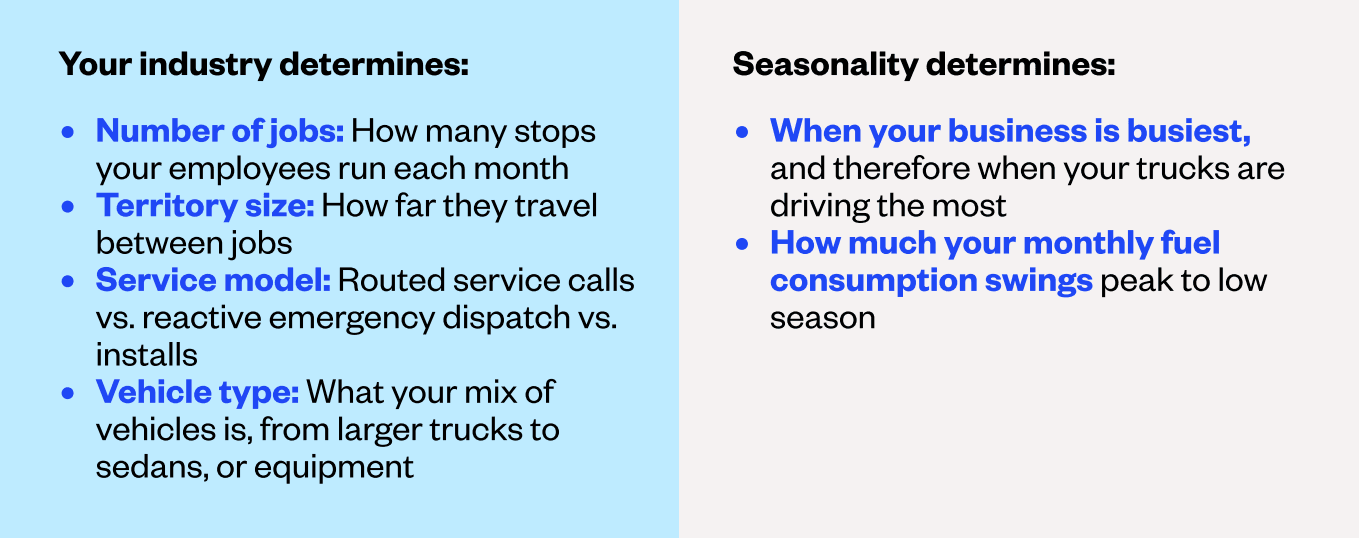
Volume, put simply, is how much driving your business requires to get work done. More miles driven = more fuel burned; more vehicles on the road = a higher total volume of gallons purchased. This is the foundation of your fuel spend, as it is the amount of energy required to service your customers. Volume is shaped by your industry and seasonality.
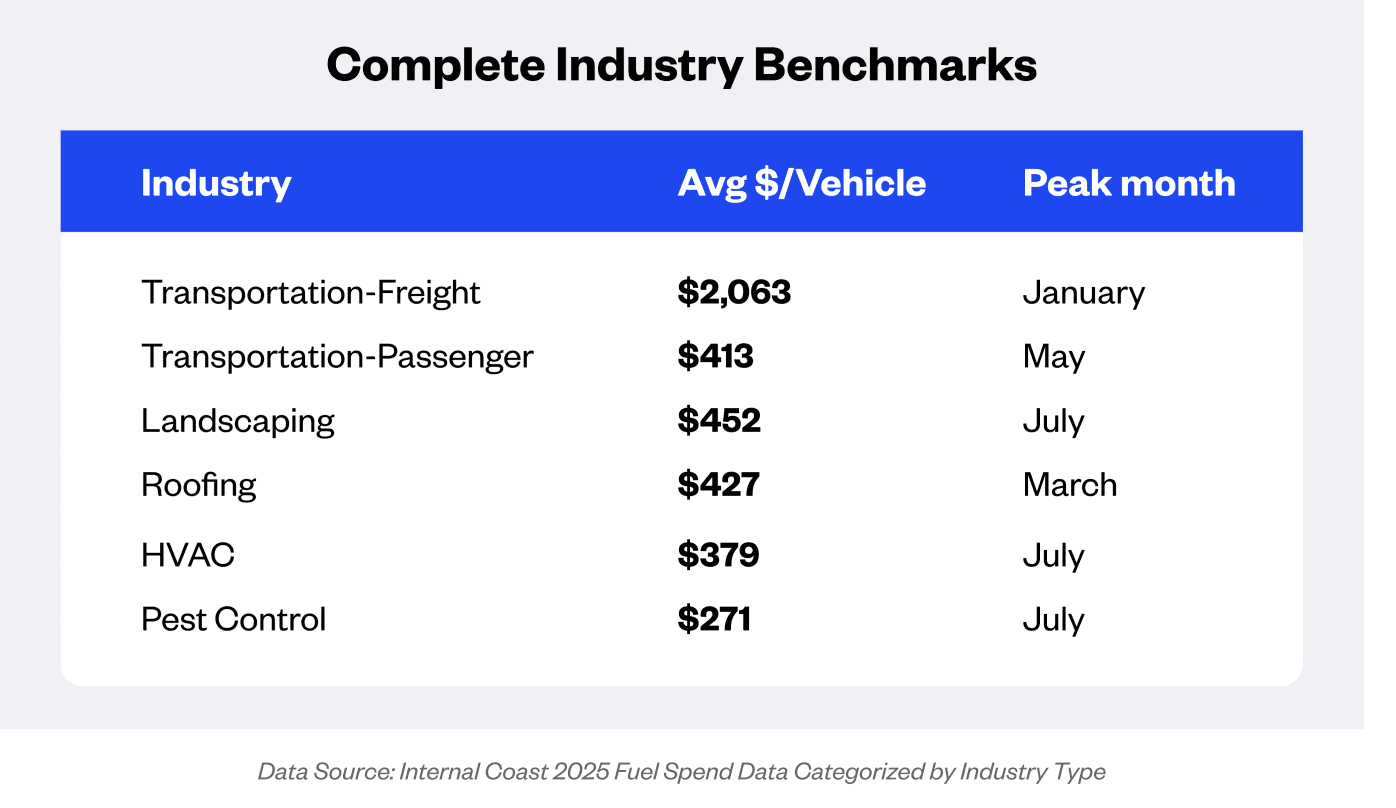
A freight hauler covering 500 miles a day will always consume more fuel than an HVAC tech making local service calls. Similarly, an HVAC fleet’s volume will naturally spike during a summer heatwave, just as a landscaping crew burns more gallons in June than in December. That’s the nature of the work, and you can’t change the type of business you operate. Instead, knowing what the baseline fuel spend is for your industry, and where you stand within this industry is the key to budgeting precisely and accurately.
Let’s first look at averages across different industries.
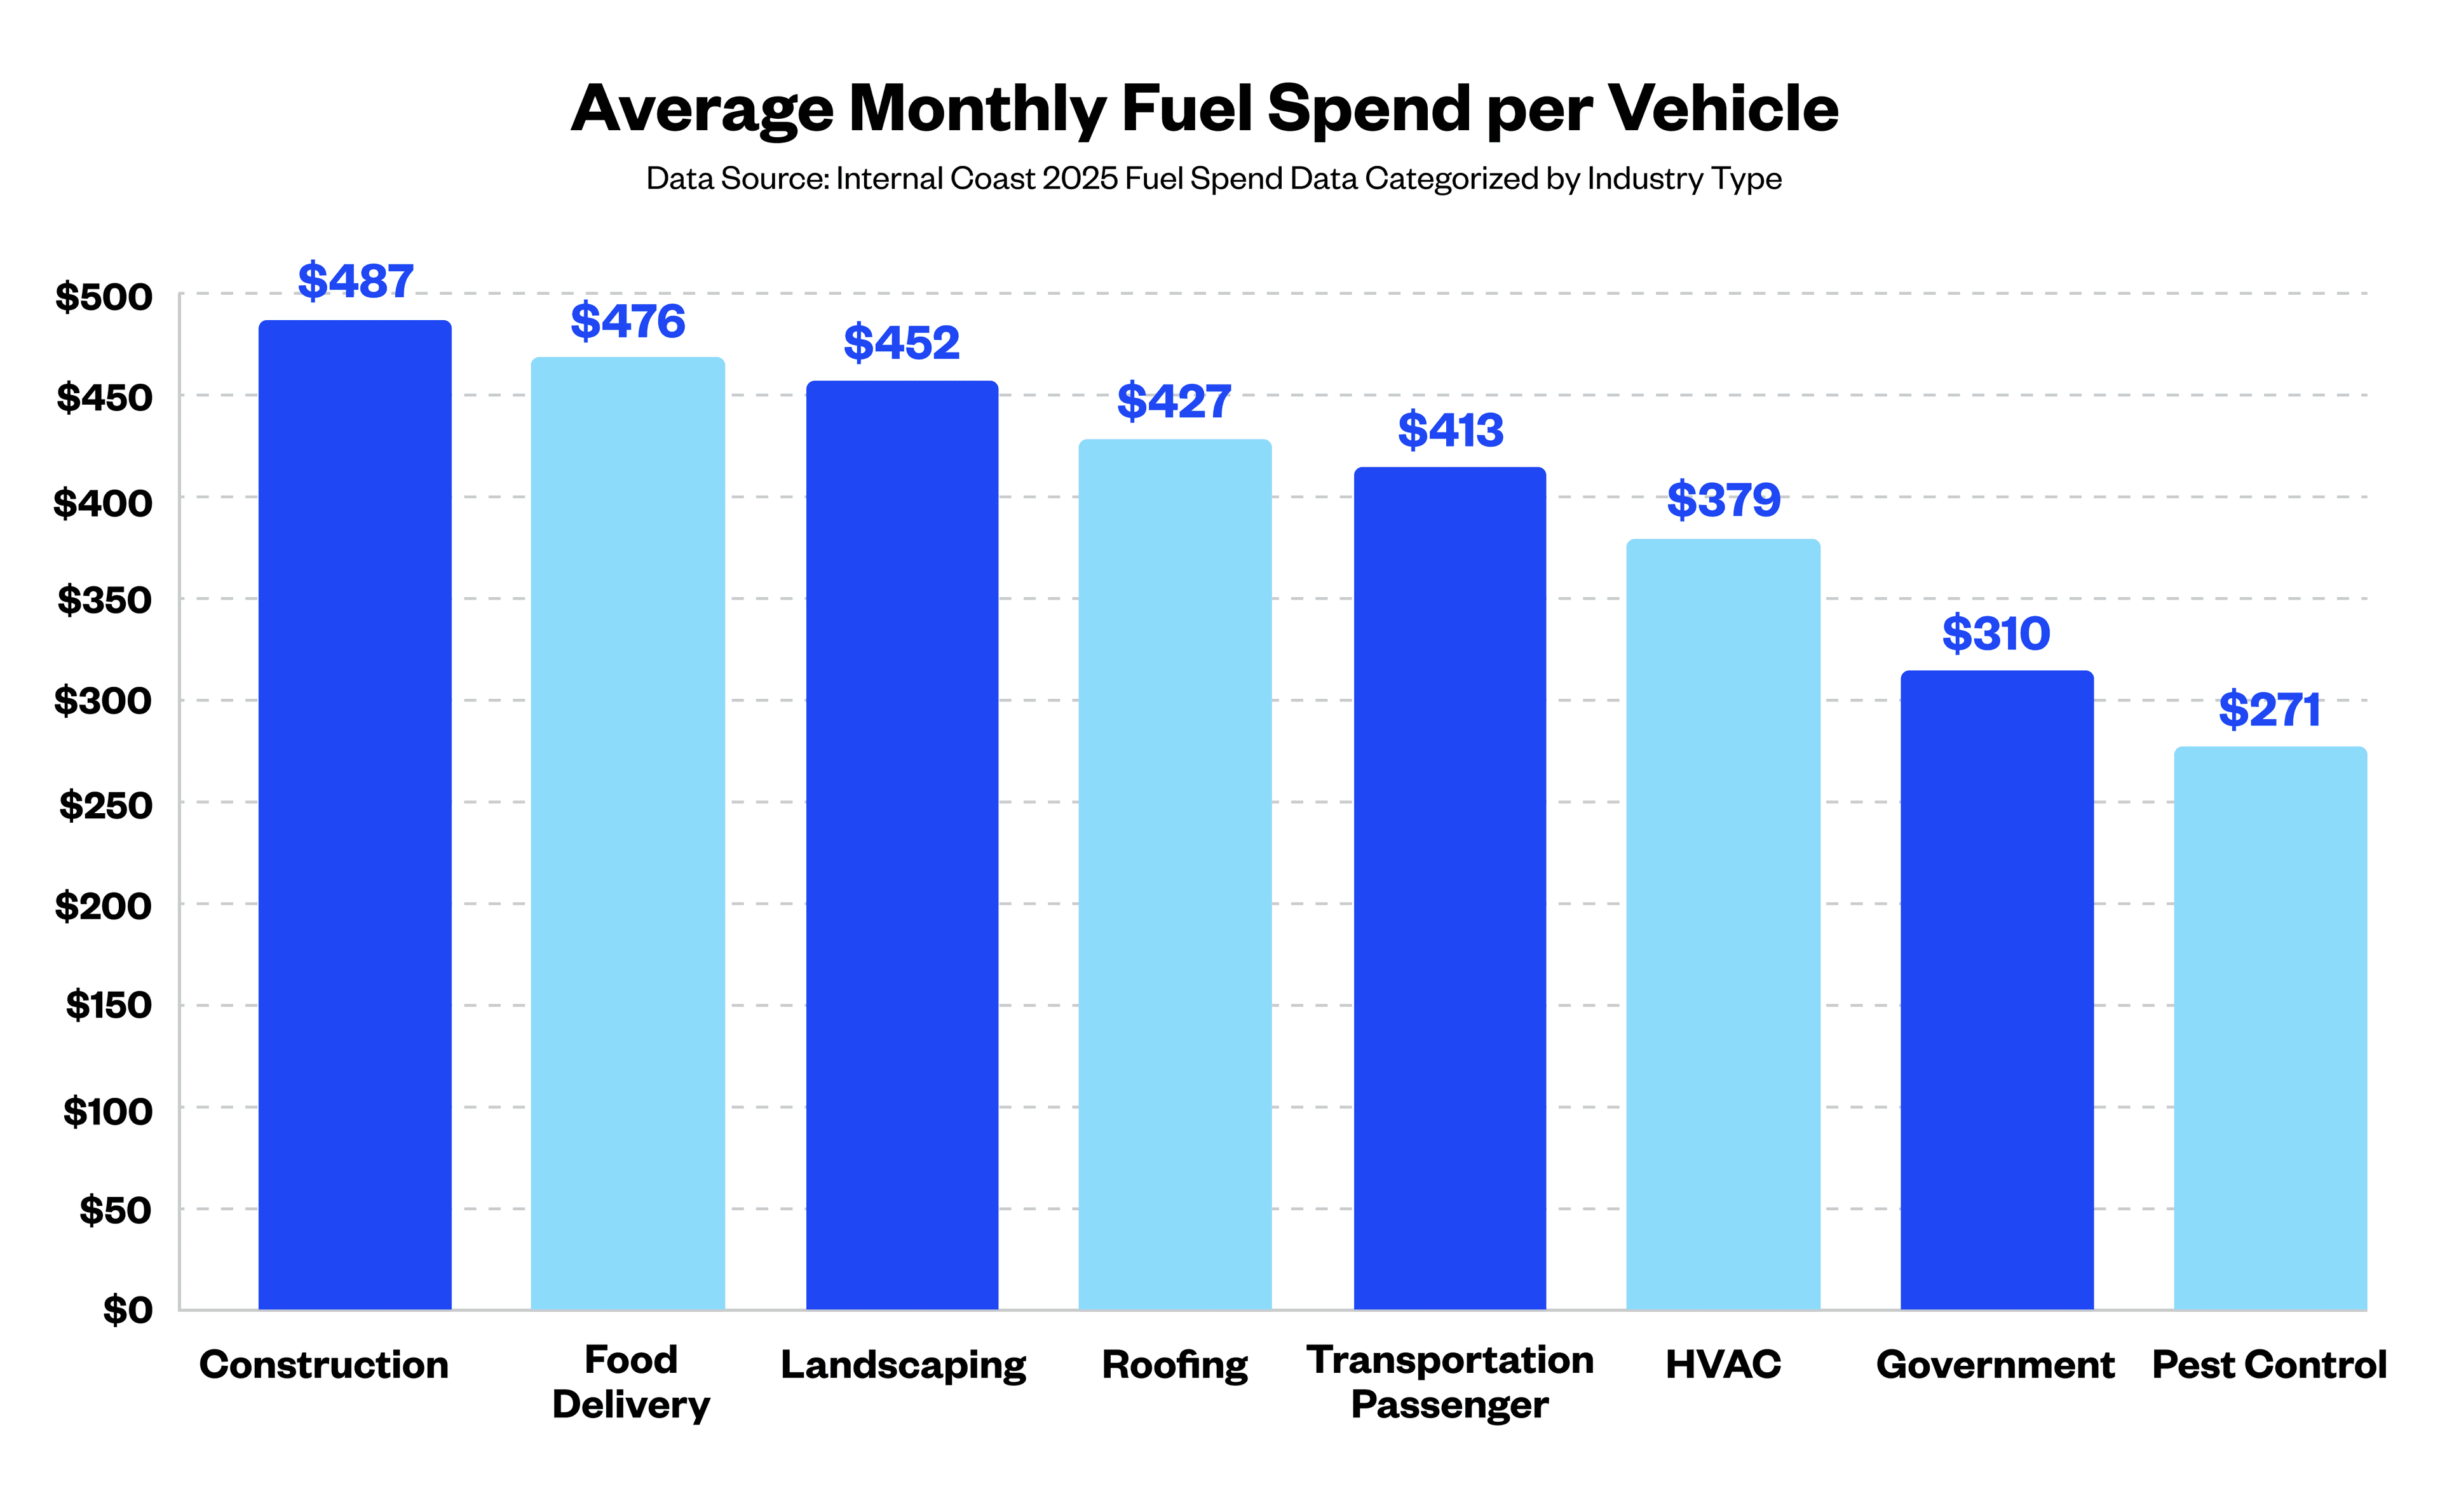
The spread is massive. Construction vehicles spend $487 per vehicle per month. Pest control spends $271. That’s not because construction companies are bad at managing fuel—it’s because their business model requires fundamentally more volume. Construction involves heavier trucks, more idling on job sites, and fuel-intensive equipment that pest control simply doesn’t require.
Seasonality: The 18% Summer Swing
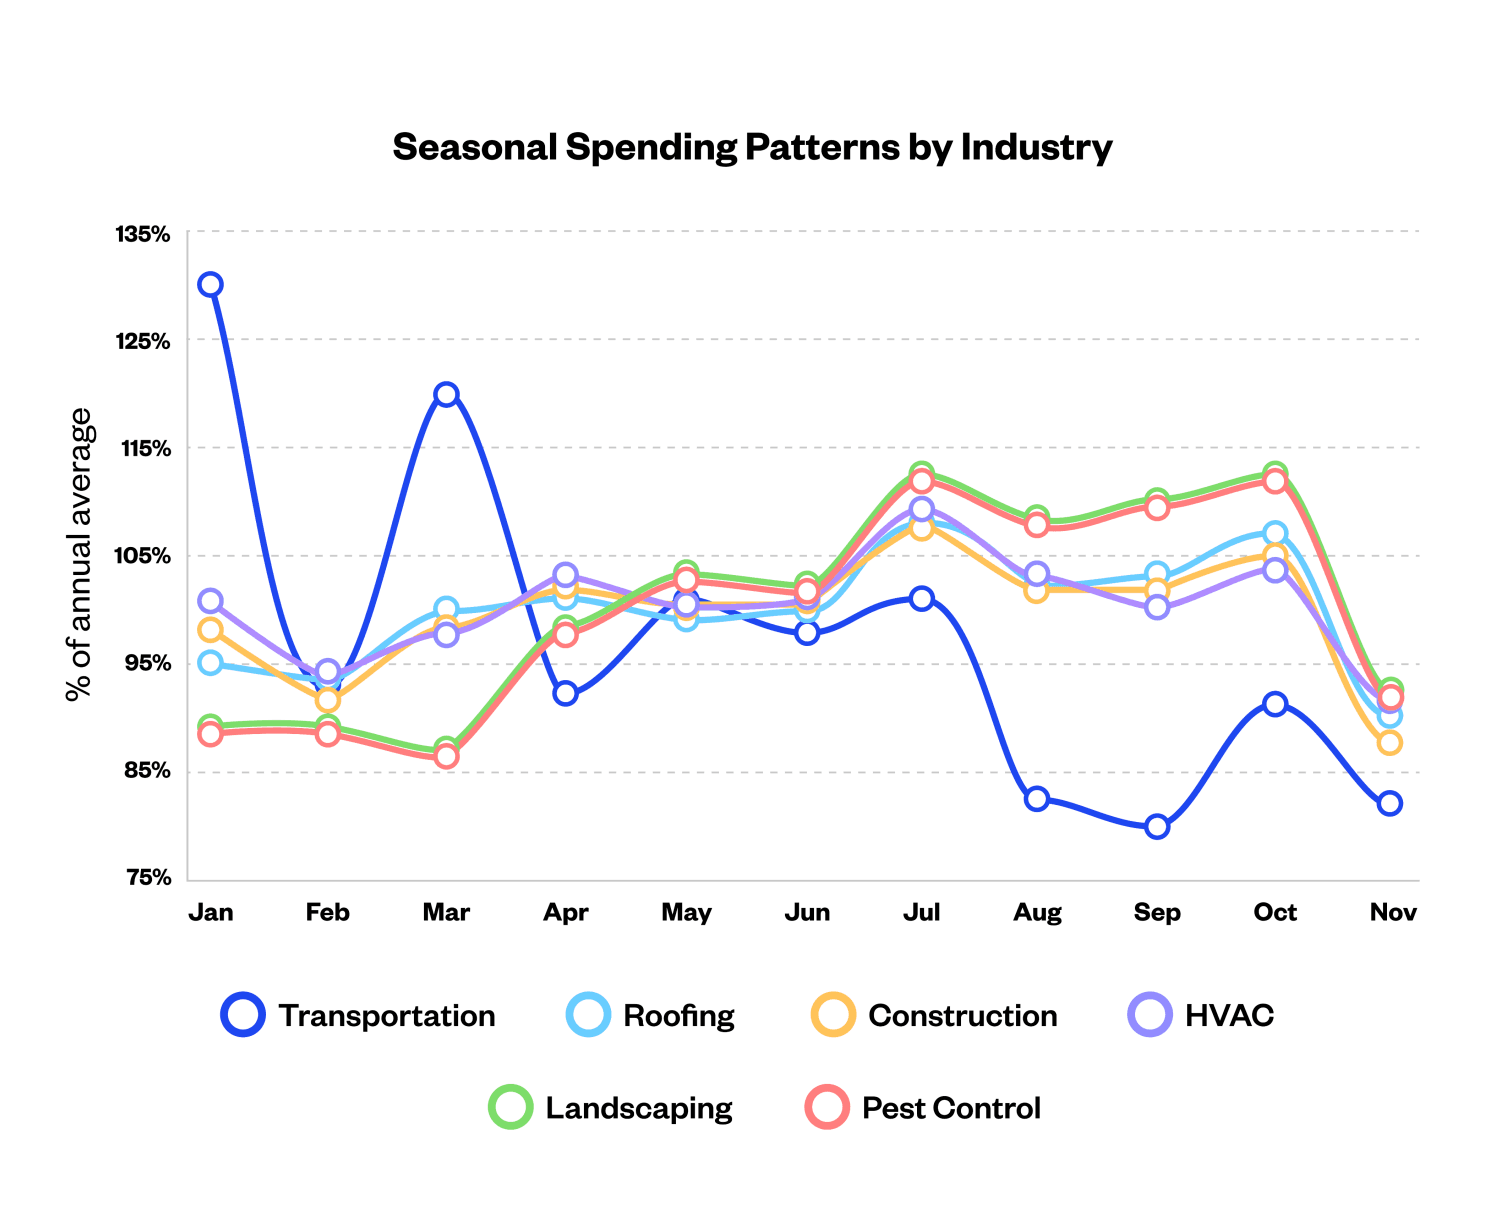
The second factor affecting volume is seasonality. Across all Coast fleets, we see an average 18% difference between summer peak spending and winter lows. Summer spending peaks at $519 per vehicle in July, 18% above November’s $439.
The summer surge is primarily caused by increased activity, which drives Volume. Your teams are working more jobs and driving more miles in the summer because business demand increases.
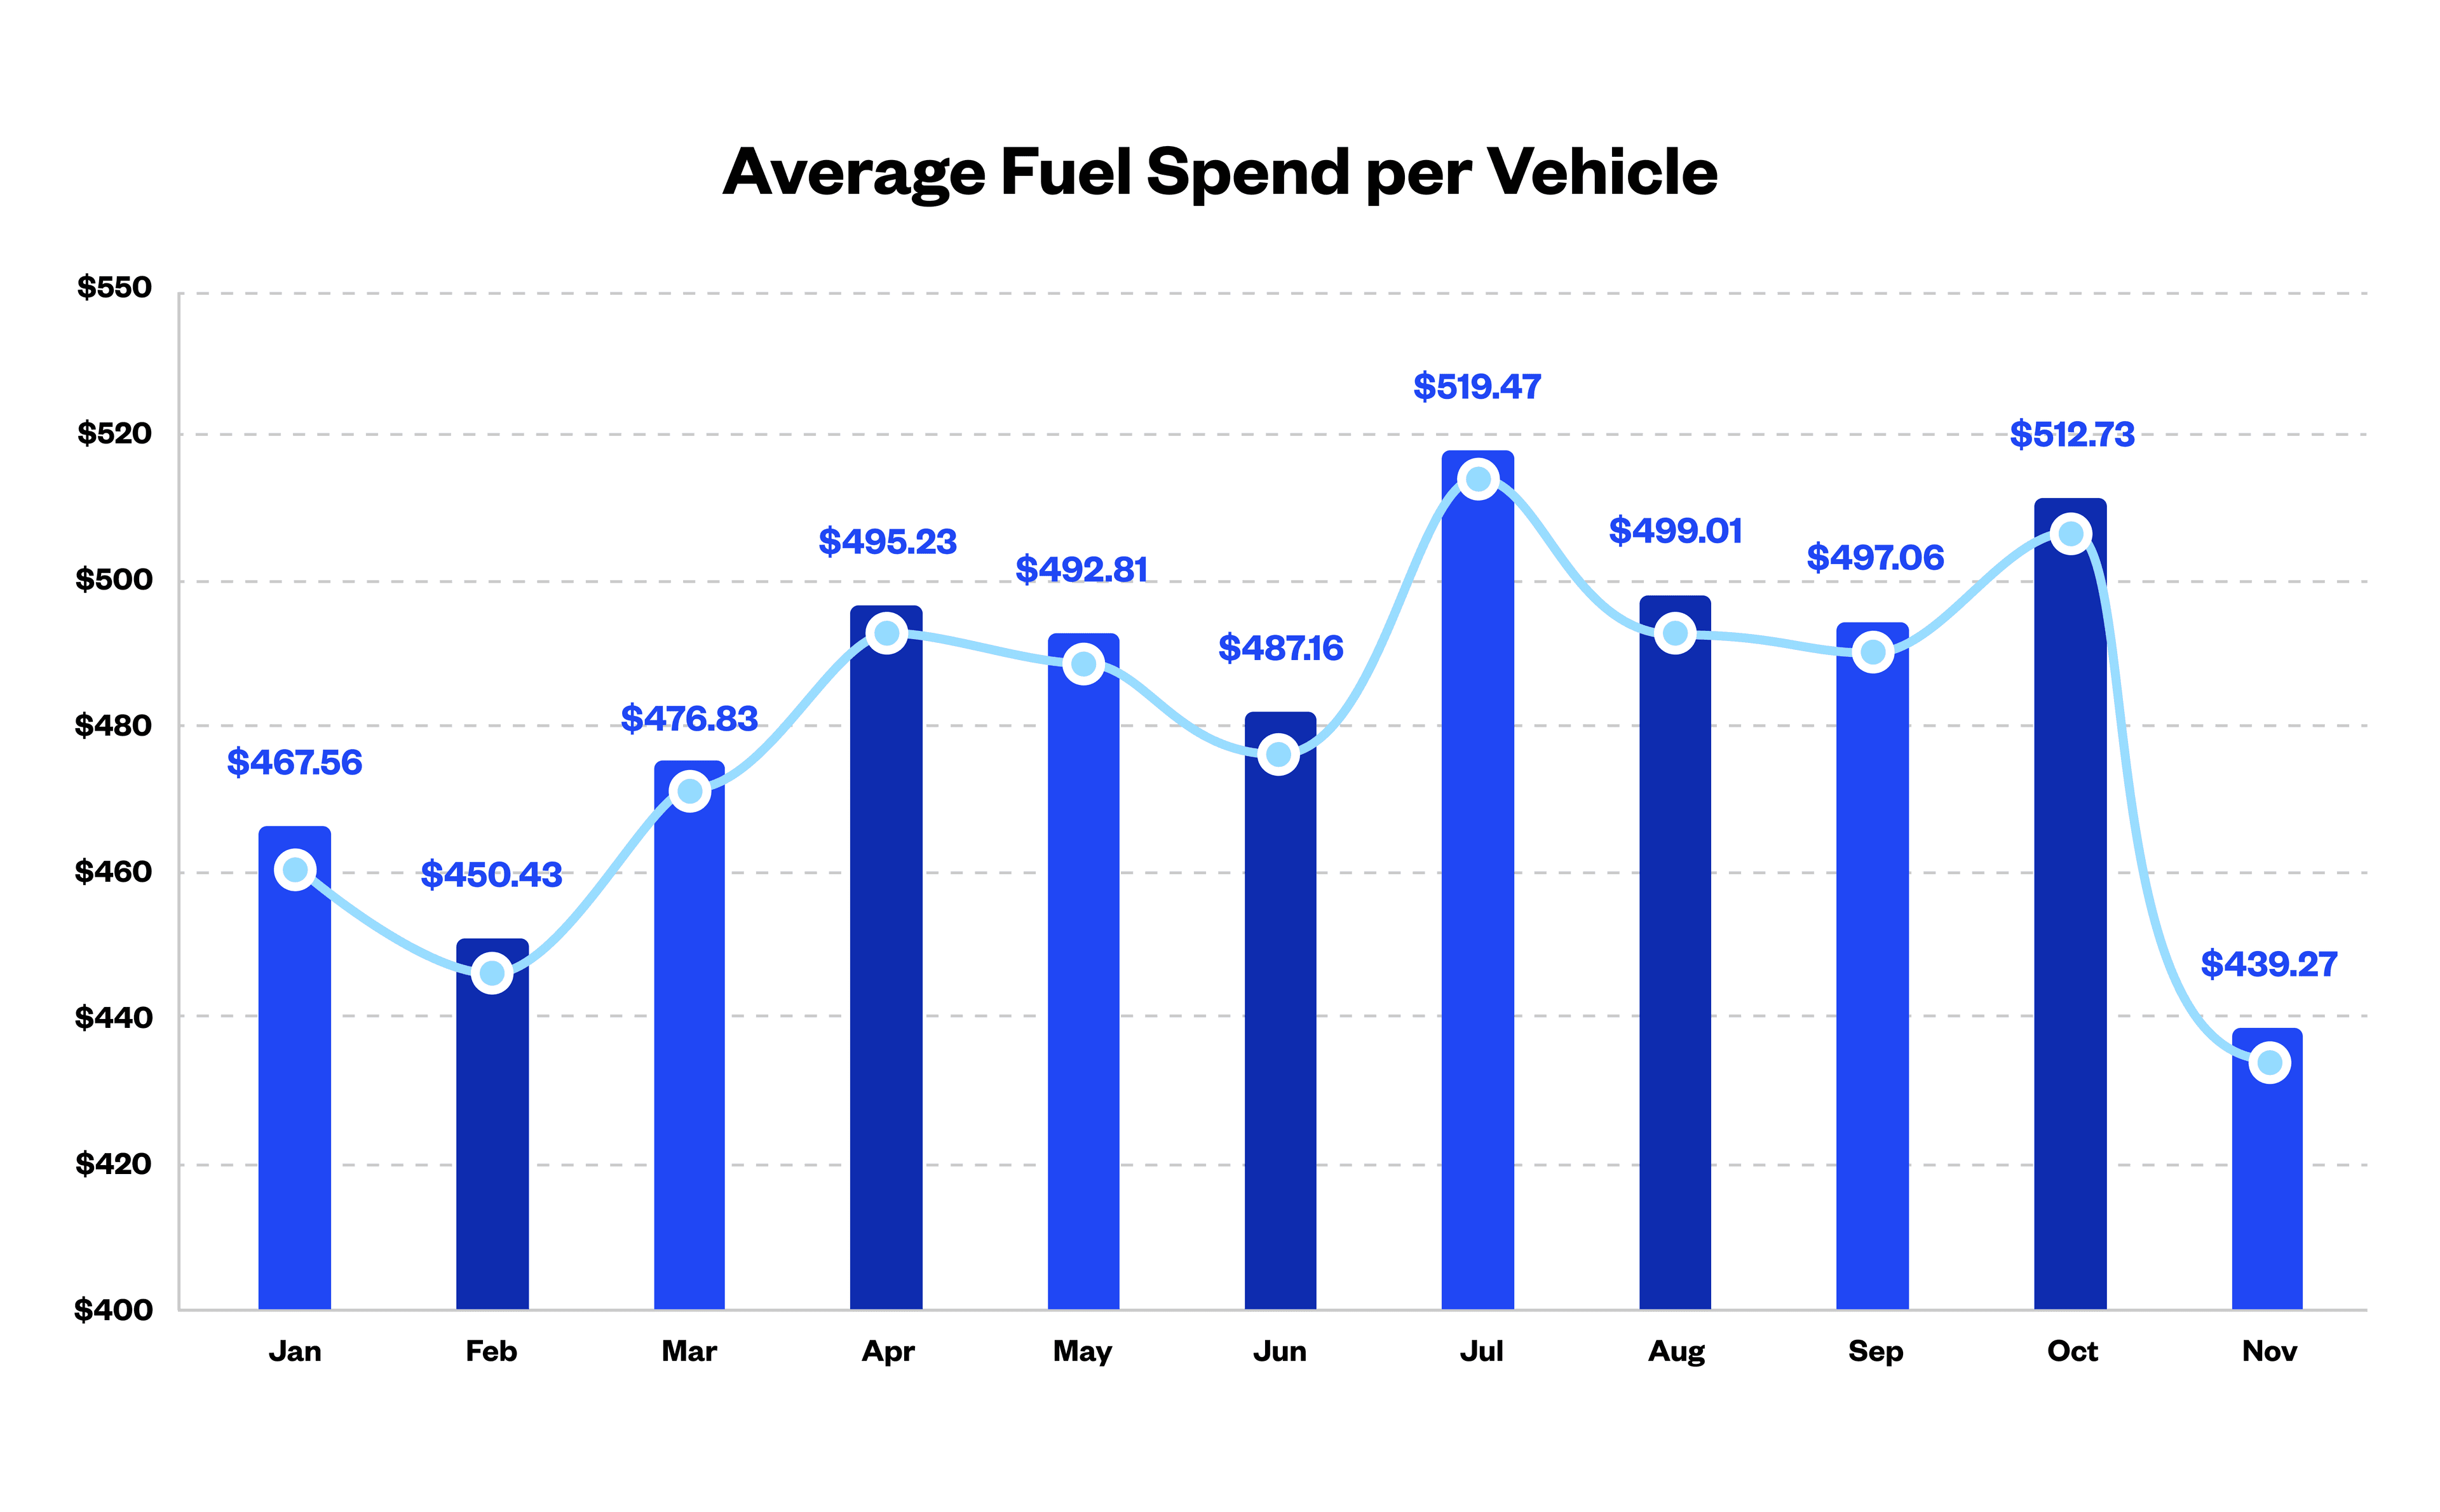
The pattern holds across most industries: HVAC, landscaping, construction, pest control all see summer peaks and late fall slowdowns. There are exceptions (and you can find out about your own industry in the Efficiency Audit section of this report), but for most trades businesses, July is the high water mark.
Location: Where You Operate & Fill Up
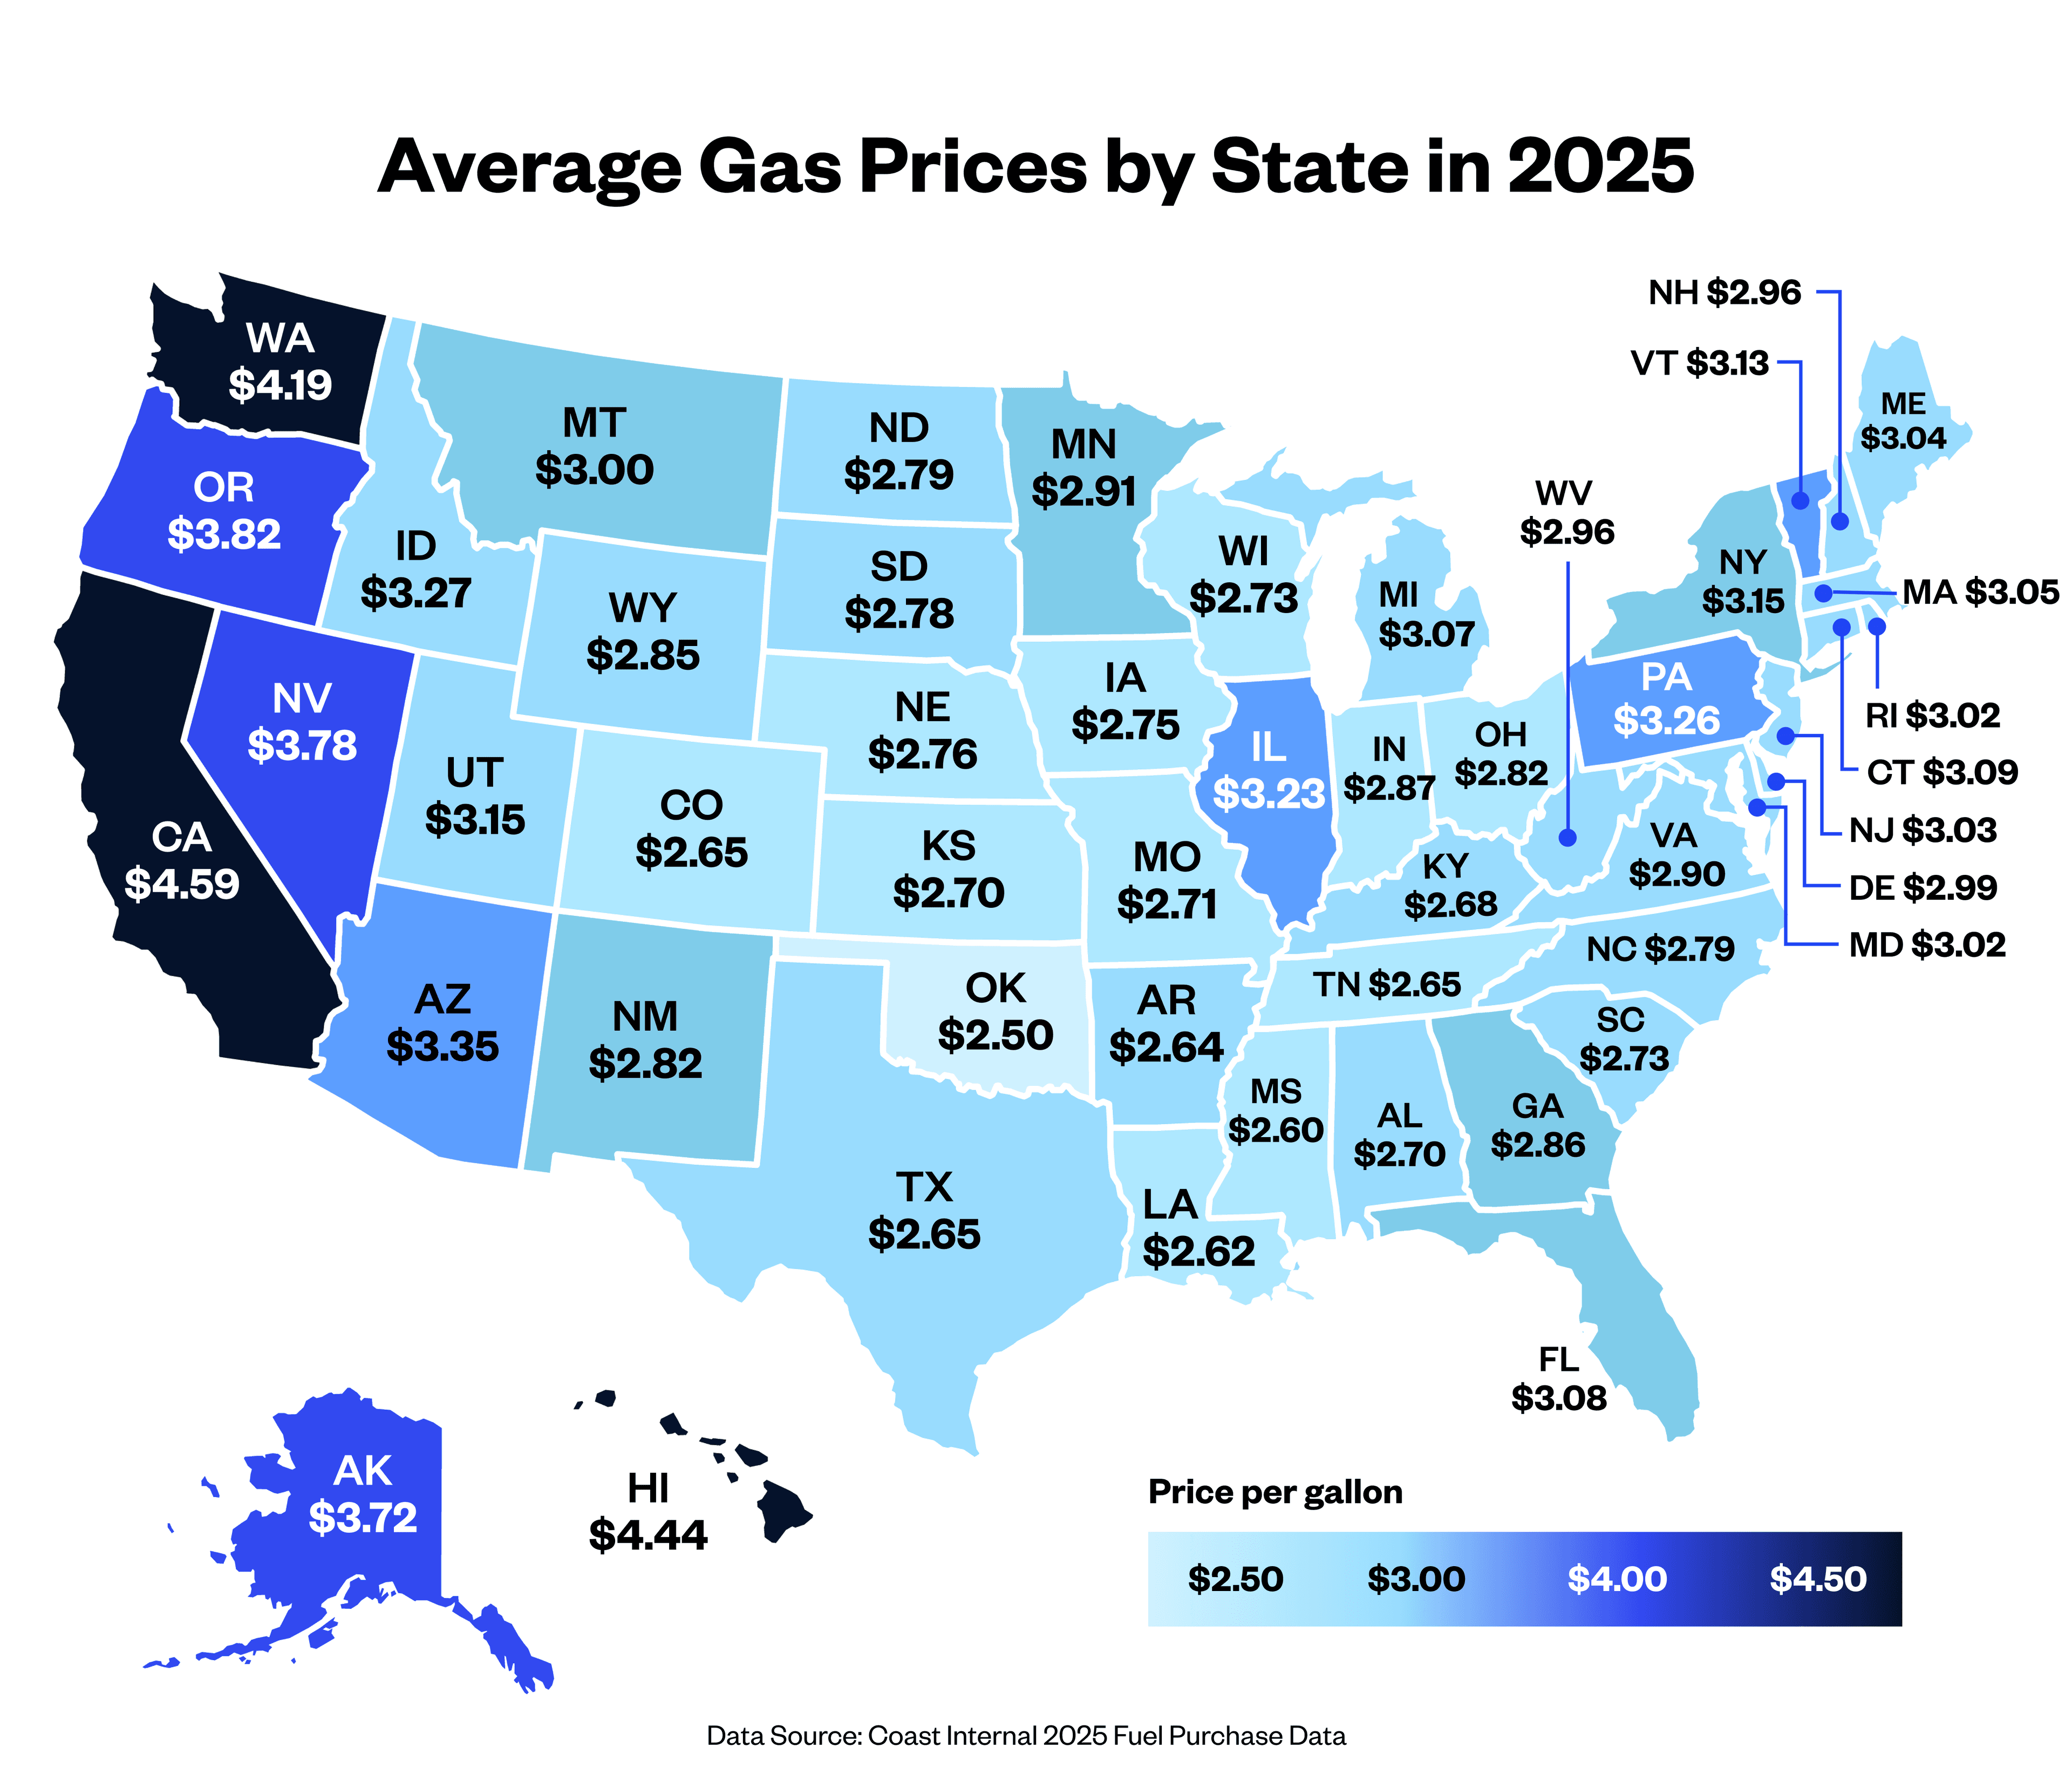
It’s no secret that fuel prices vary dramatically by state and region. A gallon of gas in California costs 40-80% more than a gallon in Texas.
Regional Price Variation
Here’s the state-by-state breakdown of average fuel costs per gallon across Coast’s 2025 transactions:
Intra-Market Optimization: The Hidden Opportunity
Here’s where many fleets miss the opportunity. Even within your own market—your city, your county, your regular service area—fuel prices vary from station to station.
Let’s look at three examples, from three zip codes:
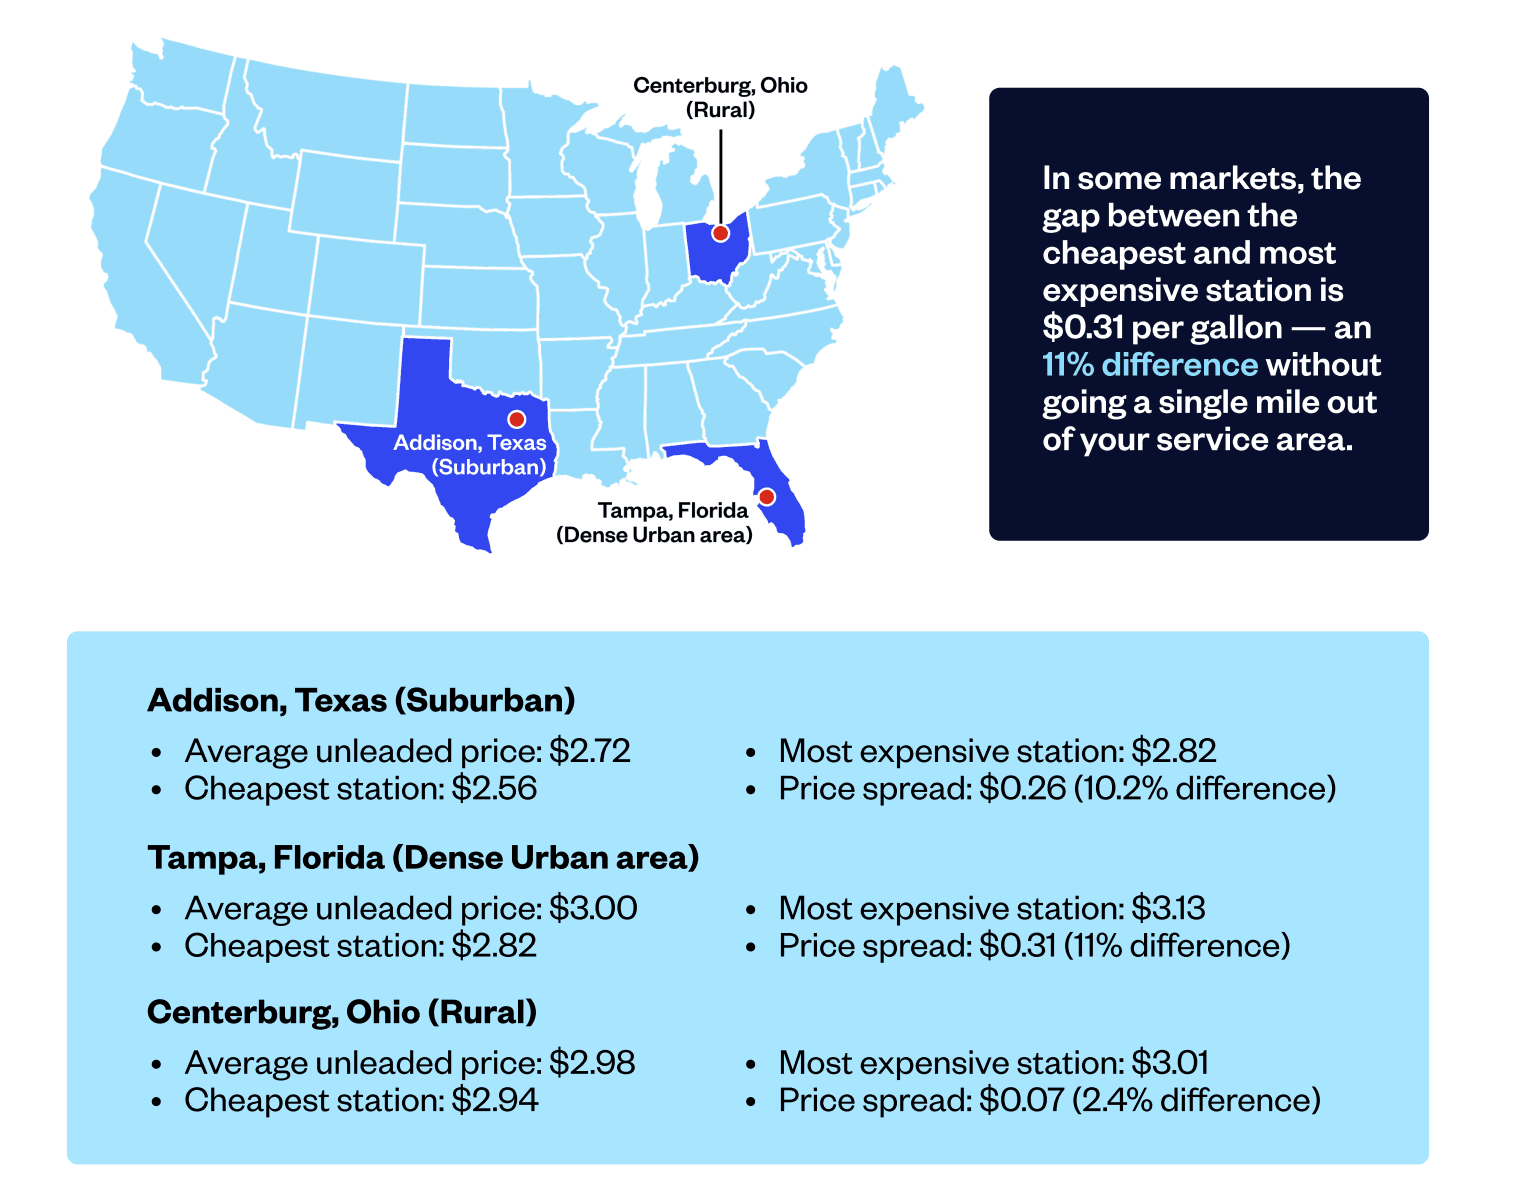
The pattern: Tampa and Addison, with more stations competing for business, show 10-11% price variance within the same market. Centerburg, a rural area with fewer options, shows less than 3% variance. Every zip code is different, but there is always going to be some level of variation and therefore, opportunities to optimize.
The lesson: Even in a concentrated market, you’ve got meaningful price variance. A 25 cents per gallon difference between the cheapest and most expensive stations in your area translates to a 10% lower fuel bill, which could mean thousands of dollars annually for even a modest-sized fleet. This opportunity is more valuable than any rebate you could be getting from your fuel card. The good news? Guiding your drivers to the right place is achievable, with the right mix of process and technology.
But knowing the savings are out there and actually capturing them are two different things.
Shopping Around vs. Station Discipline
Most fleets shop around today. The average Coast fleet fueled at 199 unique stations in 2025. But some fleets are more disciplined than others.
Without station discipline, costs add up fast: The average Coast fleet fueled at overpriced stations (10%+ above market rate) 109 times in 2025. That’s more than twice per week paying premium prices, likely because there’s no system in place to guide behavior.
By focusing on the most cost-effective stations in your area, you can save 10% of your annual fuel spend. You might not want your drivers going miles out of their way, and keeping flexibility is important—but guiding behaviors toward better pricing is a key opportunity most fleets ignore.
Smart fueling decisions help control costs at the pump. The next piece of the puzzle is how efficiently your fleet uses that fuel once they’re back on the road.
Operations: How Efficiently You Run
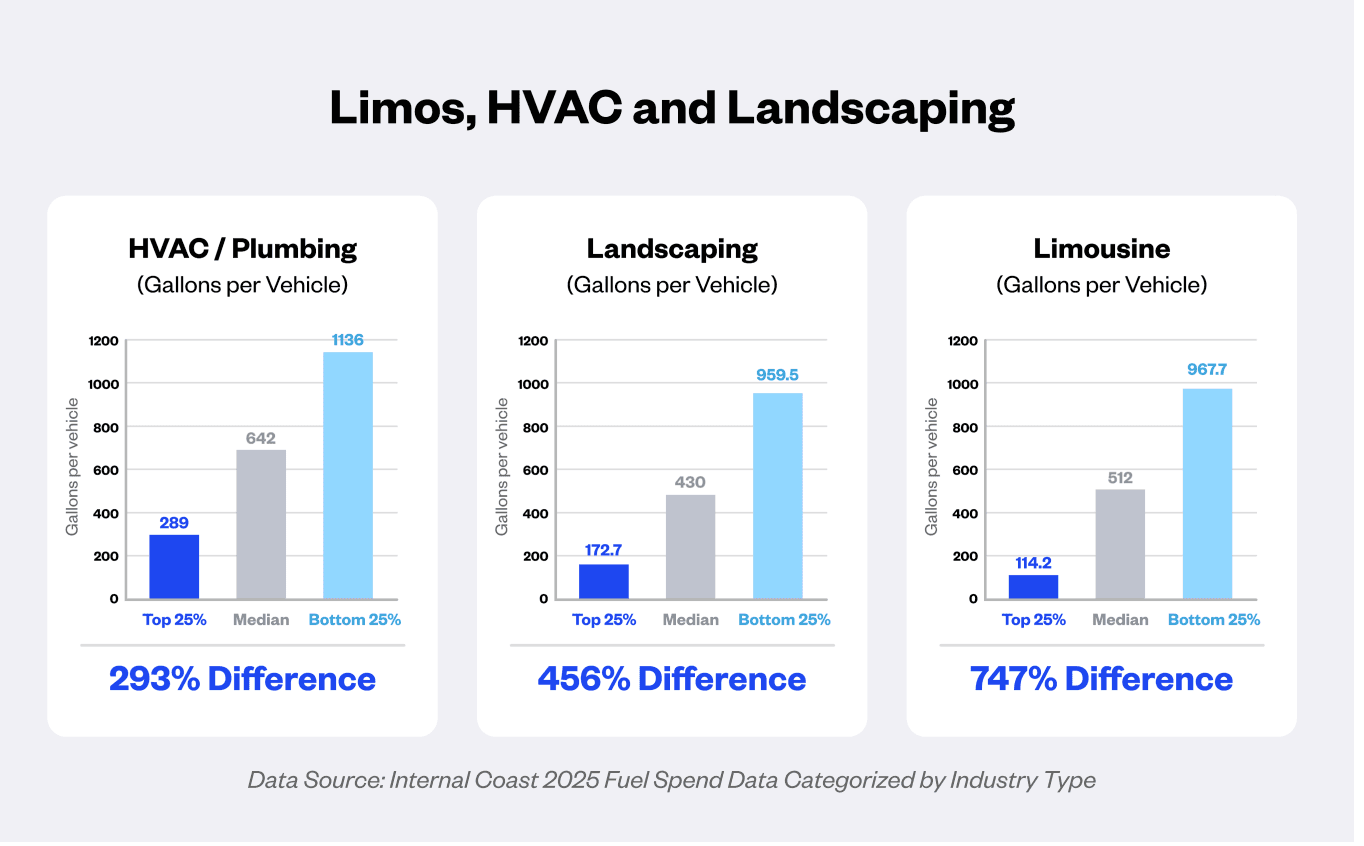
Operations are where efficiency separates average fleets from top performers. Fleets operating in the same industry, in the same region, with the same fuel prices, show massive variance in spending. That variance comes down to how optimized fleet management is.
Fact 1: Within the Same Industry, Some Companies Are More Efficient Than Others
Within the same industries, the efficiency gap is significant:
Fact 2: Larger Fleets Are More Efficient Than Smaller Ones
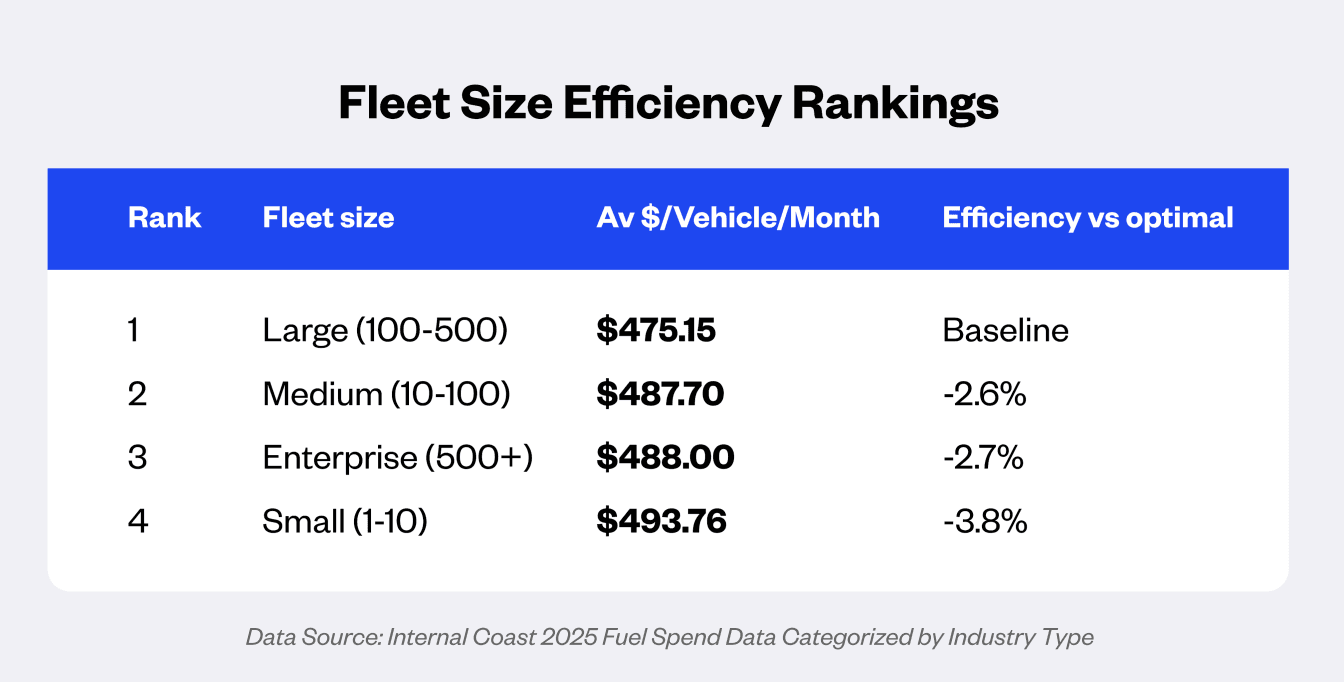
Interestingly, our data shows a clear correlation between fleet size and efficiency. Across all industries, fuel efficiency improves as fleet size increases.
Fleets with fewer than 5 vehicles are consistently the least efficient segment across every industry we analyzed. The efficiency gains from scale are substantial: HVAC fleets with 30-99 vehicles show 31% lower median spend per vehicle compared to 1-4 vehicle fleets. The gap is even more pronounced in other industries: 54% for limousines and 64% for landscaping.
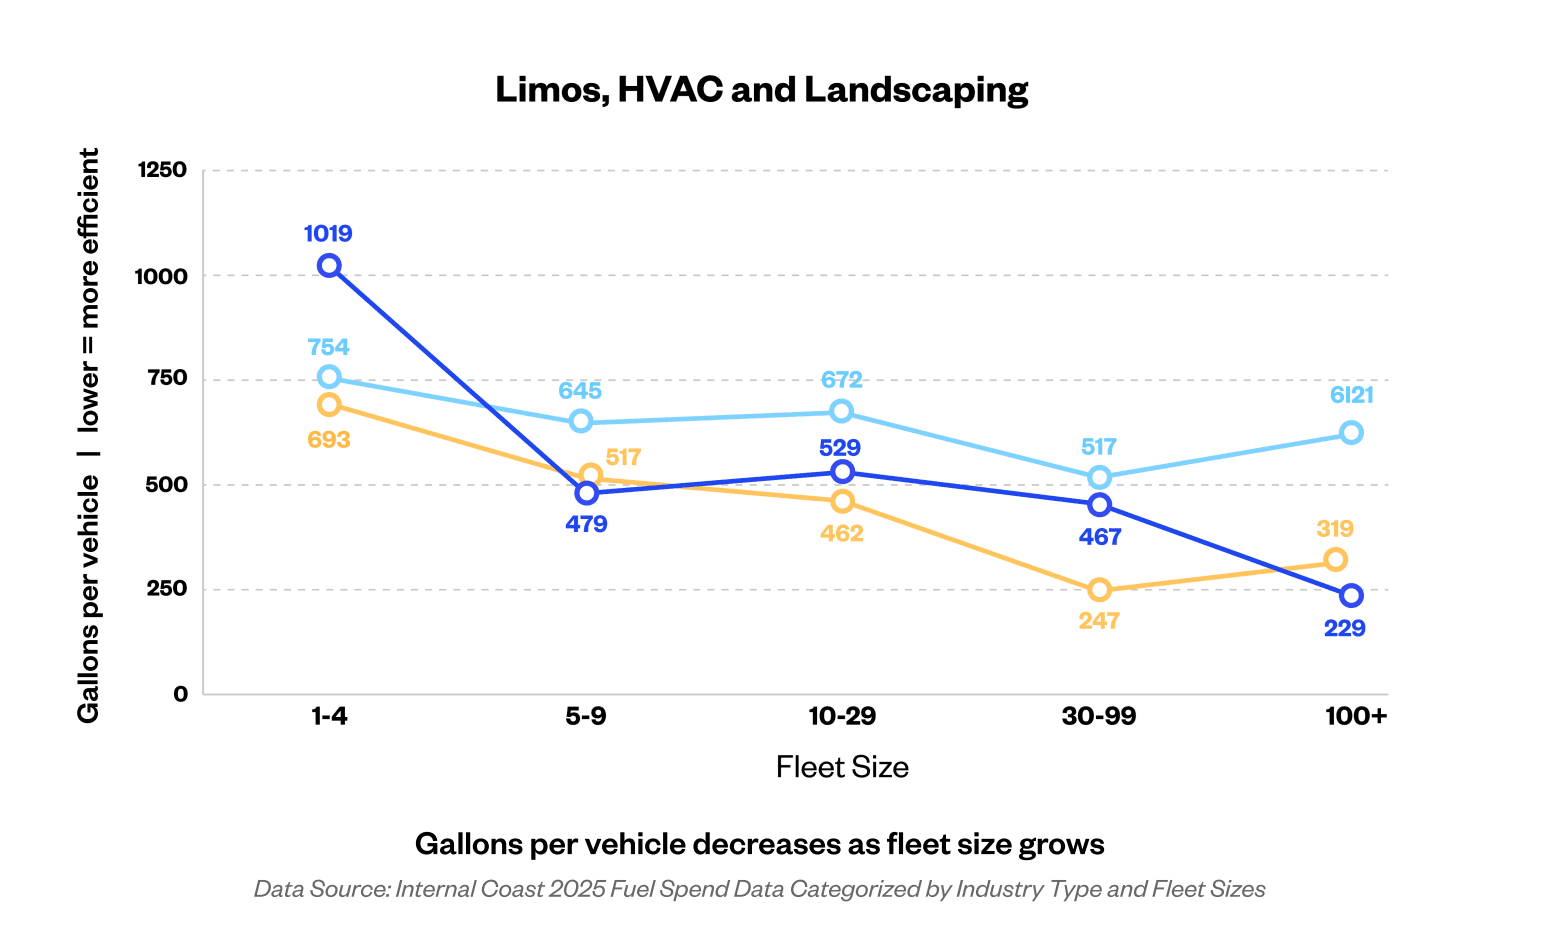
There’s one interesting wrinkle in the data: peak efficiency doesn’t belong to the largest fleets. Across every industry, the 30-99 vehicle segment outperforms the 100+ category. It’s possible that once fleets get large enough, the complexity of managing hundreds of vehicles starts to create inefficiencies that offset the advantages of scale. Or it could be that the largest fleets are simply serving different types of customers or markets that require more fuel-intensive operations. Either way, the sweet spot for operational efficiency appears to be the mid-sized fleet.
Why larger fleets are more efficient:
- Better negotiating leverage with fuel suppliers
- More resources to invest in route optimization software
- Dedicated fleet managers focused on cost control
- More formalized and strict spending policies
- Economies of scale in vehicle purchasing and maintenance
What this means for smaller fleets: You’re starting from a disadvantage, but that makes operational discipline even more important. You can’t out-negotiate a 500-vehicle fleet, but you can out-execute a competitor your own size by focusing on the right areas.
Factors You Can Control
Let’s get specific about what drives that operational gap between top-quartile and bottom-quartile fleets.
1. Driver Behavior
Aggressive driving dramatically reduces fuel economy. According to the U.S. Department of Energy:
- Highway speeds: 15-30% lower MPG with aggressive driving
- Stop-and-go traffic: 10-40% lower MPG with aggressive driving
Hard accelerations, excessive idling, speeding—it all adds up. The difference between a smooth operator and a lead-foot driver is measurable in gallons per week.
2. Fraud Prevention
Fraudulent fuel transactions—personal use, unauthorized purchases, card sharing—are estimated to cost fleets roughly 3% of total fuel spend (Coast internal data). For a fleet spending $100,000 annually on fuel, that’s $3,000 disappearing into personal tanks and side trips.
Most fraud isn’t sophisticated. It’s an employee gassing up their personal vehicle on a company card. It’s a driver sharing their PIN with a buddy. It’s transactions happening when the vehicle isn’t at the pump.
The best fraud prevention is invisible. It stops problems before they happen, without creating friction for legitimate purchases.
3. Route Optimization
Poor routing burns fuel unnecessarily. Every mile driven that doesn’t contribute to revenue is waste. Backtracking, inefficient stop sequencing, deadhead miles—these are controllable inefficiencies.
Even a 5-10% reduction in total miles driven translates directly to fuel savings.
4. Vehicle Maintenance
A poorly maintained vehicle burns more fuel. Period.
- Tire pressure: 3% MPG improvement for every PSI of under-inflation corrected
- Air filters: Clean filters improve fuel economy
- Engine oil: Proper oil weight and regular changes reduce friction
- Alignment: Misaligned wheels create drag and reduce efficiency
5. Rightsizing Your Fleet
Are you running oversized vehicles for the jobs they’re doing? A one-ton truck on a route that could be covered by a van is burning extra fuel for no reason.
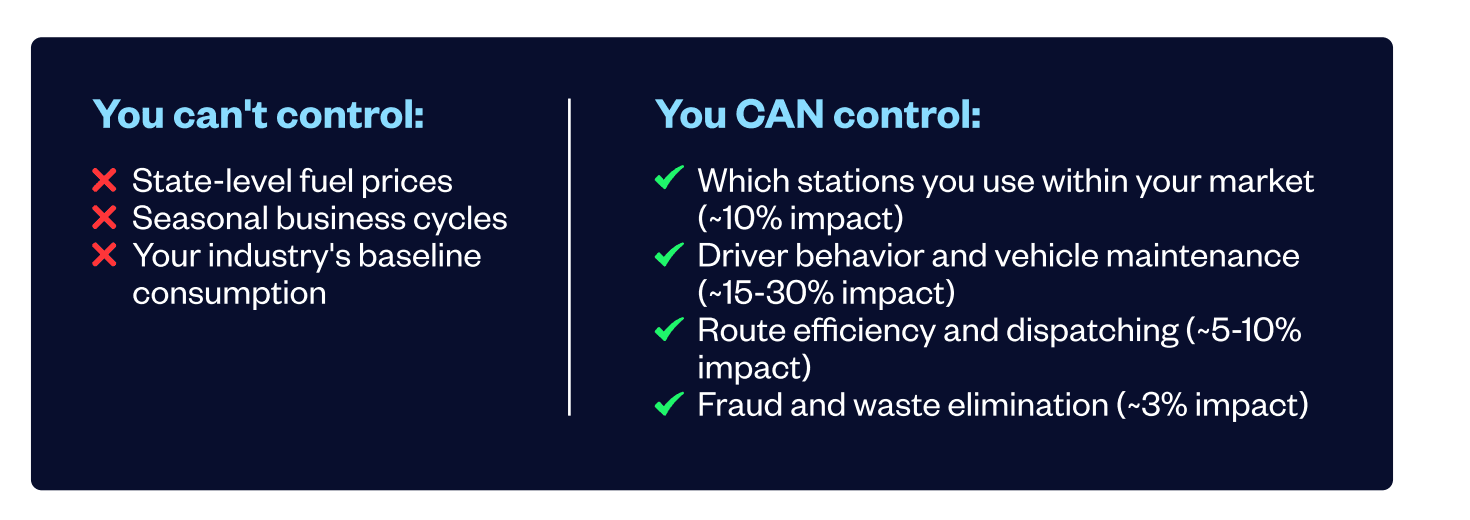
There is a lot within your fleet’s control. Now, the question is: where does your fleet currently fall on the efficiency spectrum? How are you stacking up compared to similar fleets? Understanding the benchmarks is the first step toward closing them. To help you identify exactly where your opportunities for savings live, we’ve broken down our 2025 data into a self-service audit.
Efficiency Audit
Use the tables below to see how your fleet stacks up. Start by finding your industry in the Complete Industry Benchmarks table — that’s your baseline. If your average monthly spend per vehicle is running significantly above that number, you likely have an efficiency gap worth investigating. Then check the Seasonal Spending Patterns chart to understand whether your high months are in line with what’s normal for your industry or whether something else is driving the spike. Finally, use the Fleet Size Efficiency Rankings to understand how your size affects your starting point. The goal isn’t to hit someone else’s number — it’s to know where you stand so you know where to focus.